


Medical staff in protective gear inside a ward specialised to receive anyone who may have been infected with the new coronavirus, at the Rajiv Gandhi Government General Hospital, Chennai, January 2020. Photo: Reuters/P. Ravikumar.
I worked out the testing performance for the states of India based off of partially reconstructed data series, since the Indian Council of Medical Research has ceased to provide information. A major finding is that testing rate growth is strongly correlated with how well a state is doing.

States that have maintained a testing growth well above the growth rate of daily positives are able to hold down the infection count growth. Those that manage to ramp it up – if not keep increasing – are able to fight down spikes and surges well.
For example, notice Bihar blowing up now. Why?

Delhi is an example of ‘ramp up when needed’ – which explains why each spike or surge has been beaten down. Notice also how Haryana maintains a consistently higher growth of tests over its positives. The same goes for Jammu and Kashmir – except for now. Gujarat on this count is the worst of all states.

Jharkhand like Delhi ramps up when needed, albeit a bit delayed. Karnataka has started maintaining that edge and so it is able to check surges now as and when they arise. Observe how inconsistent Madhya Pradesh is. Kerala maintains a very small edge because it can afford to with its community programmes.

Any surprises that Maharashtra’s growth is unchecked? Observe Odisha for contrast. Punjab and Rajasthan also ramp up when needed, but of late Punjab appears to be registering the importance of maintaining a decisive edge.

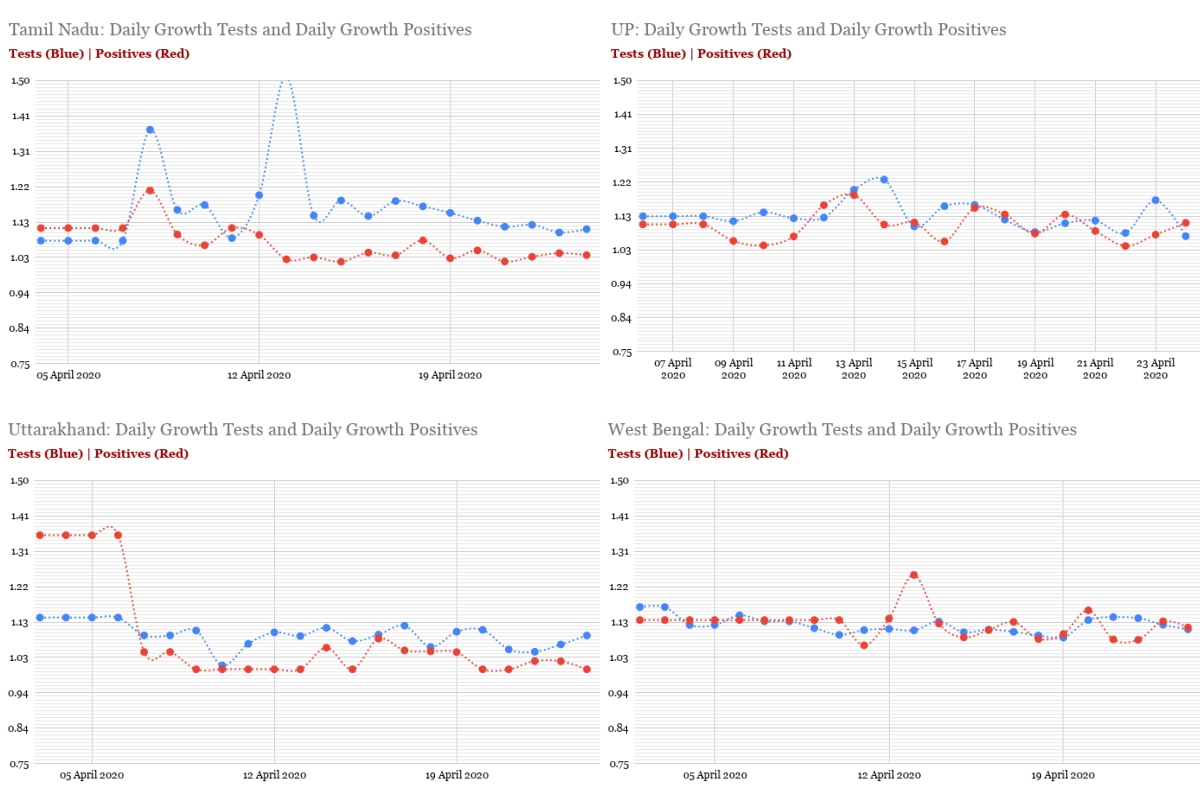
Now you can also see how Tamil Nadu has achieved a negative growth rate of the number of new active cases. And how Uttar Pradesh lost the control it seemed to have early on. And why Uttarakhand is doing okay while the number of cases in West Bengal is growing unchecked.
Now, when you look at the aggregated data of India, you can see why the lockdown has not been able to do more than merely dampen the daily growth of infections – i.e. slowing it down to a middling rate and preventing it from spiking. This explains why the data shows no evidence of the virus having been contained yet.

Since it may still not be clear to some, I’m continuing this thread with the impact of state testing on the national case count. I plotted the percent of total (i.e. national) tests that states have conducted with the percent of total (national) positives results they have each contributed.
The impact of Andhra Pradesh’s edge is clearly seen in the decline in its contribution to the national total of positives. Delhi’s ramp-up-when-needed also manages to suppress its contribution. Bihar’s testing growth has declined and we see the blow-up now. And any doubts as to why I called Gujarat the worst?

Haryana maintains a constant edge and the effect is clear for all to see. Karnataka has decided to do the same, and to the same effect. Jammu and Kashmir is ramping up when needed but needs to do better now. Kerala has maintained a nice, clear (albeit slight) edge throughout, and the results are apparent.

Madhya Pradesh didn’t increase its testing and you can see the effect on the rising number of positive results as its contribution to the national count. Ditto for Maharashtra. Punjab has been ramping up when needed and is now taking an edge, which is noticeable. Rajasthan is also ramping up when needed, so it has been unable to bring the positives’ growth down.

Tamil Nadu has taken the edge on testing and driven the number of positives down. Uttar Pradesh has clearly lost its way (especially by April 10), and now we’re seeing the difficult time it is having driving the growth down. West Bengal hasn’t done much and so we’re seeing its positives climbing up.


The question is what more the government needs to know what it must do – and how. It isn’t rocket science at all. the lockdown must be accompanied by a commensurate and effective testing campaign, with further efforts to trace, test and isolate. The data clearly shows which states are failing the national effort.
Let me add a couple more things for clarity’s sake as well as to drive home the impact of testing. The effects of testing more on the count of new cases daily on Haryana – maintaining an edge – and Gujarat – doing the opposite – are apparent. The same goes for Delhi and Maharashtra.


If growth rates are not easy to understand, here’s the same picture of the states above in terms of the doubling time – which is the time taken for a parameter to double. States doing well can be said to be doubling the number of tests they conducted in a shorter period. (The formula for doubling time T = log N(2)/log N(growth rate).)
As is visible, Bihar and Gujarat are doing the opposite of what needs to be done, so the doubling time of positives has declined (i.e. the number of positive results is increasing), which in turn means there are more new cases every successive day.

All four states here are doing well. And credit to Karnataka: it seems to have figured out that the ‘Haryana approach’ is the way to go if it means business.

It’s not difficult to understand why Madhya Pradesh and Maharashtra are struggling: they haven’t been able to accelerate the testing growth rate past the rise in the number of positives they have encountered. And notice the contrast with Kerala and Odisha.

You can also see how Uttar Pradesh lost its early grip on the situation by allowing the rate of growth of positives to outpace that of tests. Punjab appears to have chosen to boost testing. Tamil Nadu has learnt well from the “supers-preader” surge.

Uttarakhand is consistently maintaining its edge on testing, while West Bengal appears to have barely responded to the growth of positives.


The impact of keeping testing growth rate well above the positives growth rate is visible in the daily new case counts’ data, and especially in Delhi’s case, which has been ramping the number of tests up at every spike or surge until the increase has been suppressed. Observe the timing of the spikes and where the two rates are when suppressed.

For evidence of more substantial impact, observe the daily new case counts of Haryana, whose testing growth has maintained an edge over positives growth, and of Gujarat, which has been doing the opposite.

The data source is covid19india.org. The gaps in the series, such as missing data for some states, were reconstructed by compounded growth interpolation. When series were terminated before the last date, they were extended to the end to maintain the integrity of totals.
The author originally published the contents of this article as a series of tweets. They have been compiled and republished here with permission.
Lt. Col. G. Raghuram (retd.) is a veteran of the Corps of Signals of the Indian Army. He trained as an engineer, has a masters’ in physics from the University of Pune and an MBA from IIM Bangalore. After heading the operations and service delivery for an internet platform, he now devotes his time to some data science interests of his own. He tweets at @UntergrundmannG.